
If you’ve been on the internet in the past few months, you’ve likely seen a lot of chatter about the current El Niño in the Pacific Ocean. This Niño has helped limit the Atlantic hurricane season significantly, while dramatically increasing the number and strength of Pacific hurricanes. Its effects are going to last through the winter, and more effects than just a lack of hurricanes are likely to impact the eastern US.
This global weather pattern will impact us here in North Georgia. There’s a lot of good and bad information out there about what El Niño can cause, so let’s take a look at some data for us here locally.
A Brief History of Super El Niño
The phenomenon now known as the El Niño Southern Oscillation (ENSO) has been known for hundreds of years, when Peruvian fishermen named the warm current over the eastern Pacific El Niño de Navidad. The term “El Niño” in the climate sense came around in the early 1880s.
ENSO is based on strong versus weak trade winds and the ocean’s response, but water temperature is the main thing you’ll hear about. The El Niño phase of ENSO results in warmer waters over the eastern Pacific, measured against the historical average.
During the El Niño phase, trade winds are weaker across the Pacific, which slows upwelling of cooler water from deep off the coast of South America. You can very, very easily see the current El Niño in the image below of sea surface temperature anomalies from September 27.
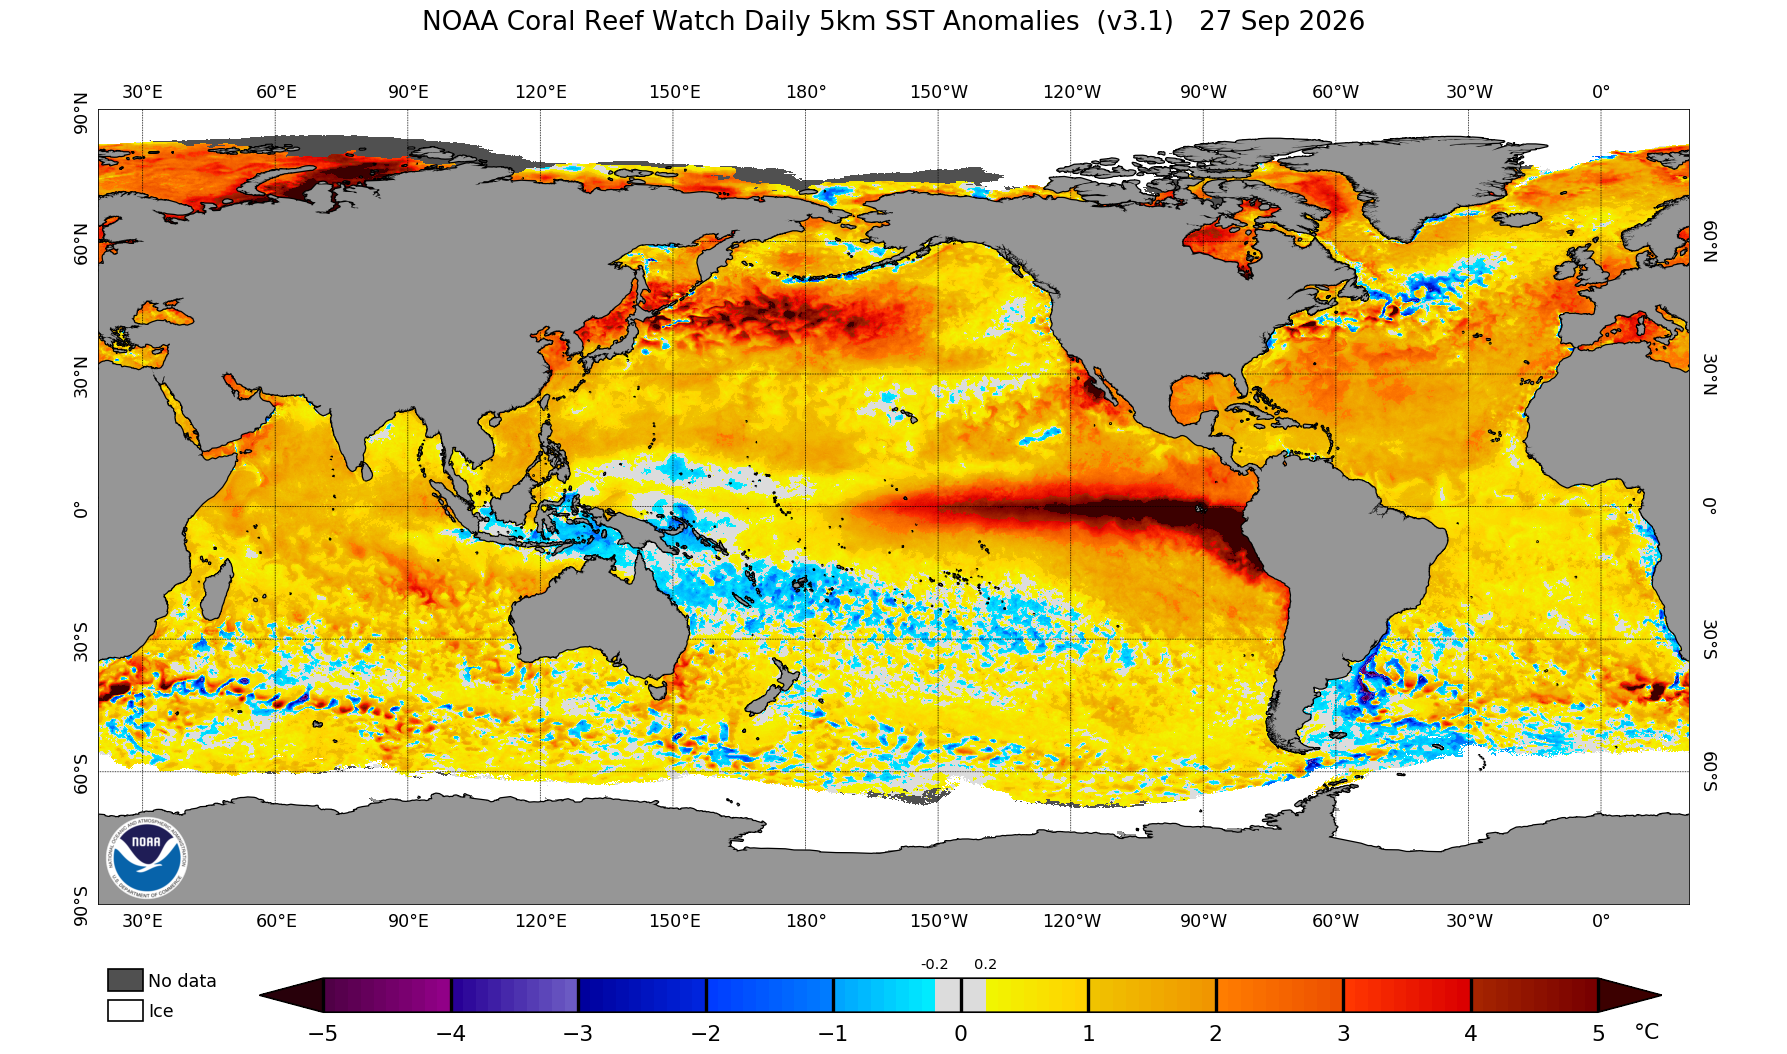
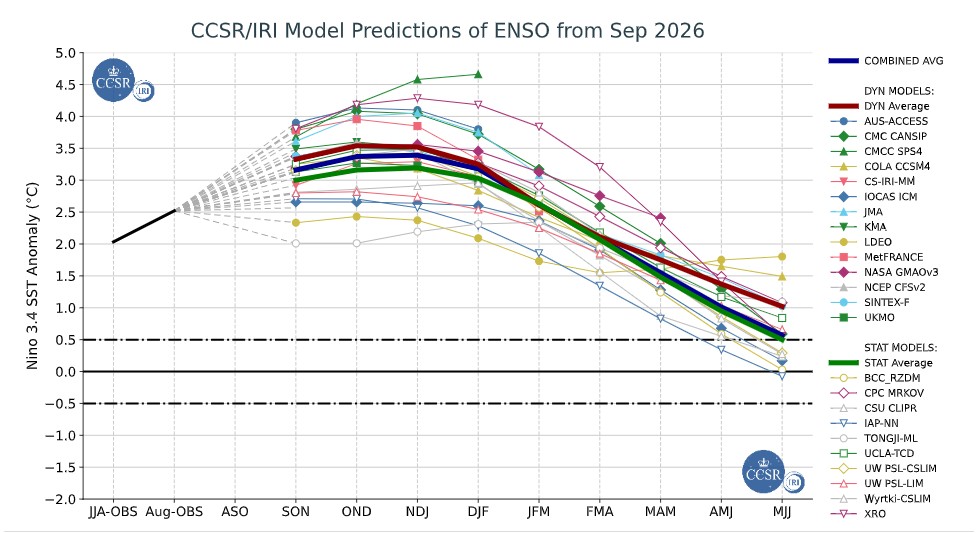
Among El Niños, strength can greatly affect the atmosphere. A “Super El Niño”, like the one we are currently in, is defined as having ocean temperatures 2.0ºC or more (3.6ºF) above average.
The latest data from NOAA shows the Niño 1 zone (furthest east) at a whopping 3.9ºC (7.0ºF), with gradually cooler waters as you move west. Overall, the regions are just over 3.0ºC, shattering the previous record of 2.3ºC that was reached in both 1997/1998 and 2014-2016. The 2014-2016 event was long-lasting, but the Super El Niño phase occurred in the 2015/2016 portion. It is possible this record was higher in 1887/1888, but it is widely believed not to have been the case, though data back then was sparse.
An additional Super El Niño occurred recently in 2023/2024, but was slightly less strong.
1982/1983 also featured one, making 5 total recorded since the late 1800s.
Super Niño in North Georgia
The first clue to what to expect this coming winter from this Super El Niño may come from our past. The five on record all brought various types of extreme weather events, from famines to massive snowstorms and floods, to parts of the globe. Generally, El Niño events bring slightly cooler, wetter weather to North Georgia, which often means more snowfall, but what about a Super El Niño?
The only station with consistent data since the 1800s is the Gainesville station, so we’ll use that for all the data you see below. The bad news is that there have been only 5 winters with data from an El Niño this strong. Despite what some news and weather outlets will tell you, this doesn’t lend itself to particularly accurate forecasting. Still, some notable trends emerge.
Super Nino Temps
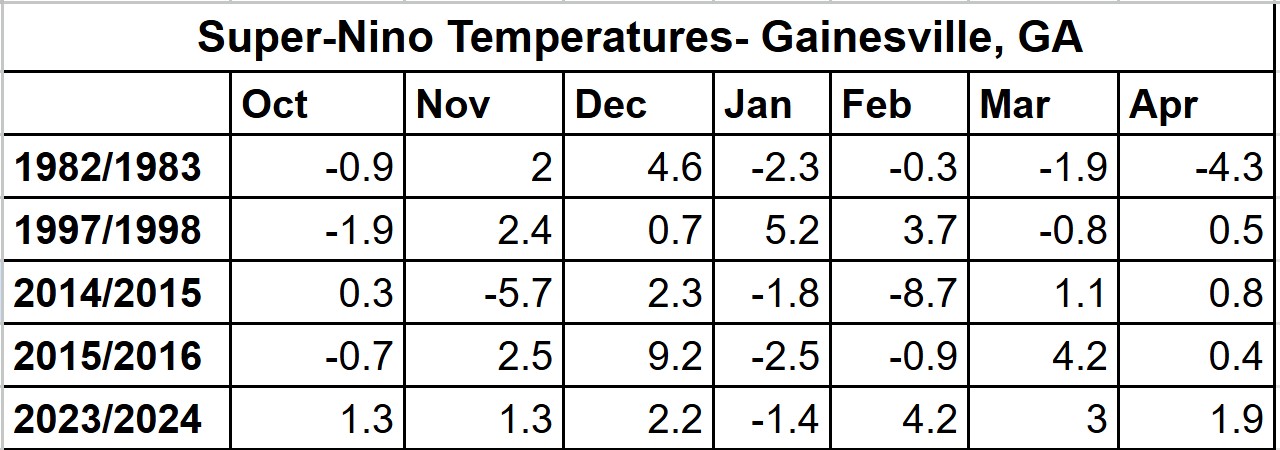
Above are average temperature departures from the Gainesville average for the 5 most recent Super El Niño winters. Of the 35 months, only 14 were below average, with 21 above average. However, 4 of the 5 winters featured below-average Januarys, and 3 of the 5 were below average in February, including a wild 8.7º below average February 2015, during the weaker phase of that ENSO cycle. Similarly, all 5 Decembers were above average, including the record-setting December 2015, and 4 of the 5 Aprils were above average.
Plotting this differently in a good old-fashioned line graph shows the wild swings between the winters.
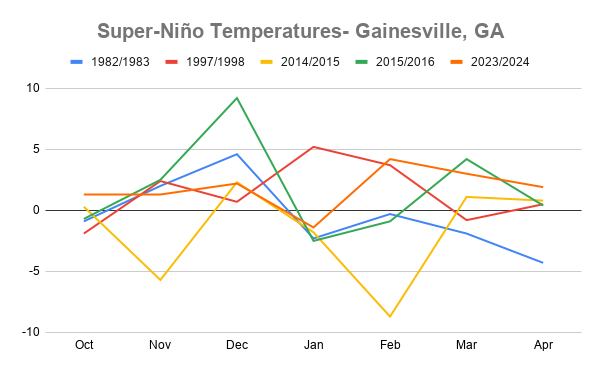
While El Niños tend to be cooler than average in general, that doesn’t hold true for Super El Niños. Too often the US is overrun with mild Pacific air during these periods, which results in generally warmer-than-average conditions, with the notable exception of January.
Super Niño Precipitation
Precipitation during Super El Niños is a bit more predictable, but there is still quite the spread. Since average rainfall varies significantly from month to month, the graphic below just drops them into relative categories instead of actual numbers.
The first thing that stands out is that slightly below to below average is the most common, with 10 of the 35 months. However, 16 of the 35 months feature above average, with far more significant above months than significant below.
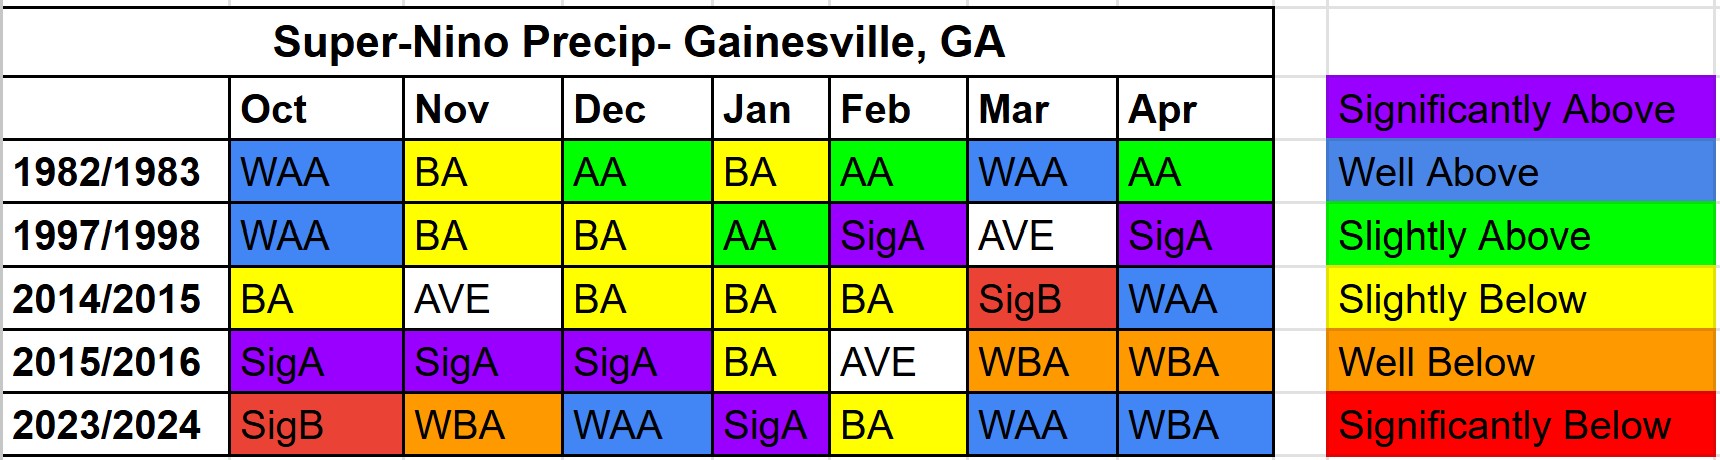
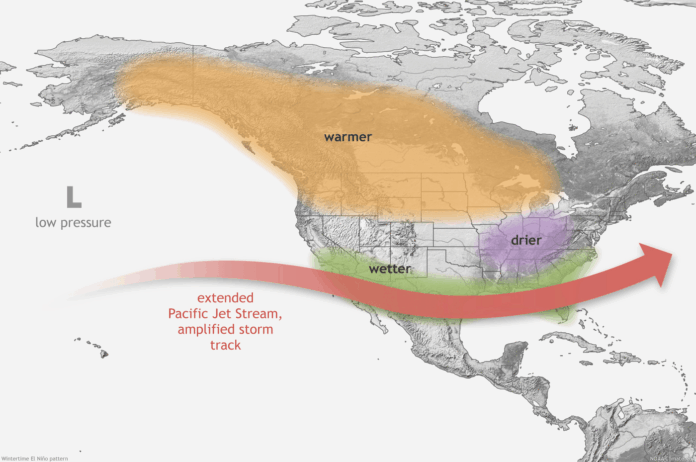
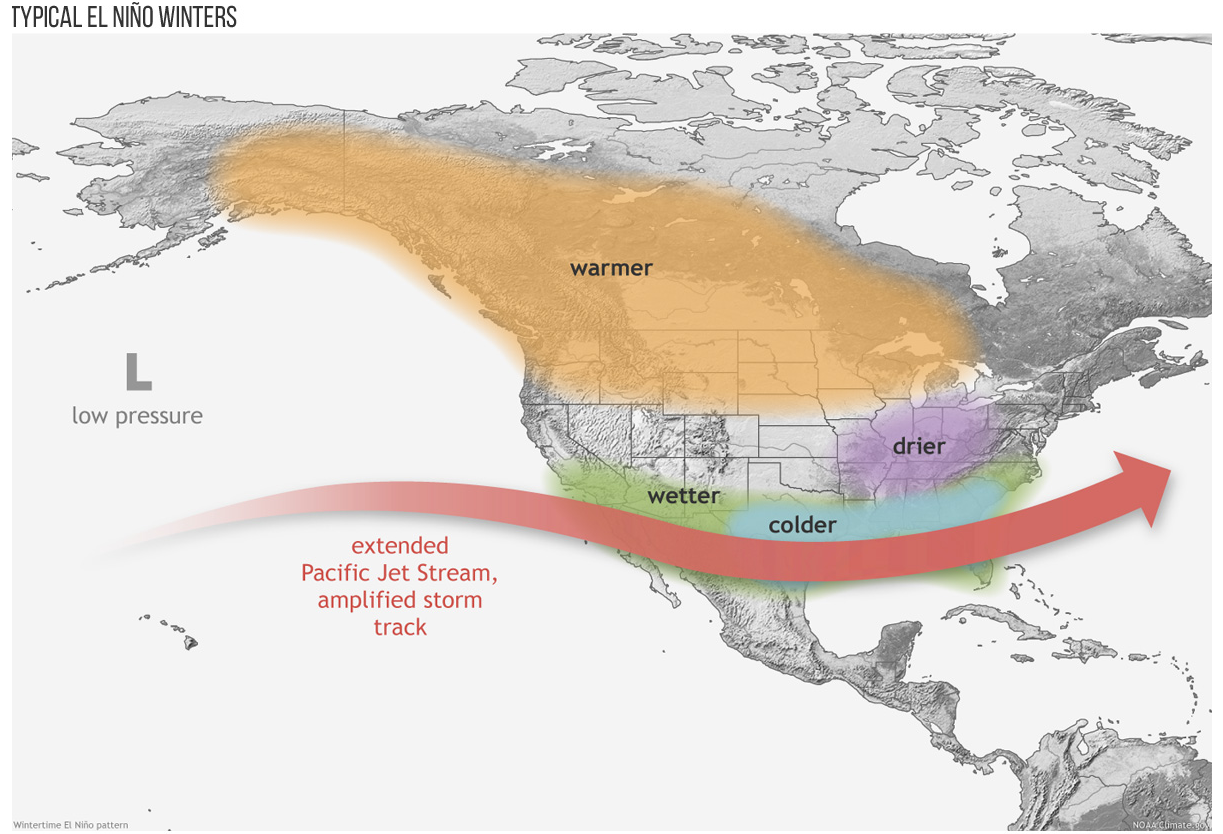
Despite the big swings in temperature, every Super El Niño has featured at least one month of well-above-average precipitation, though when it occurs varies. This is due to a very active storm track and Pacific jet stream that nearly always sets up across the south. This brings many low-pressure systems much farther south and, as you see below, results in a cooler, wetter pattern in the southern US. That said, a dry area generally sets up somewhere in the Tennessee Valley, and the variations in where that axis sets up result in the below-average versus above-average years.
Snow and Tornadoes
The biggest talking point around El Niños in the South is, without a doubt, snow. Statistically, an El Niño does tend to produce patterns more favorable for snowfall across the South, but that doesn’t hold true in our limited experience with Super El Niños. In fact, only a couple of snow events have been recorded during these years.
The winters of 1982/1983, 1997/1998, 2014/2015 (a milder winter in that phase), and 2023/2024 brought no widespread snow events to North Georgia. You may note that both January 1982 and 2014 produced Snow Jam and Snowmageddon, but neither occurred during El Niño.
Records show that Cornelia has only recorded 1.2″ of snow during Super El Niño winters, both of which came on the tail end of the 2014-2016 event. Not a good sign for snow lovers.
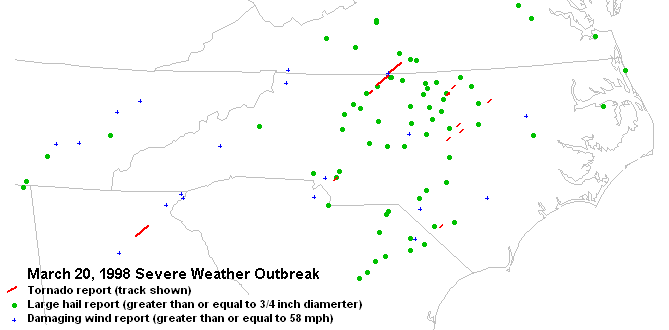
Alternatively, Super El Niños seem to be really good at producing one thing across the Southeast: severe weather.
To name just a few: the mid-south tornado outbreaks of December 1982, deadly March 1998 Gainesville tornado, deadly December 2015 mid-south tornado outbreak, separate outbreaks in November 2014, December 2014, November 2016, and the Nashville tornadoes of 2023 ALL occurred during Super El Niño winters.
A stronger El Niño can often send plentiful mild air across the US from the Pacific Jet Stream, a result of a more amplified and northerly storm track. These storms jumping north earlier puts the southeast squarely in the southeastern quadrant of these low pressure systems and in the severe weather zone.
Still, every year is different, and no one knows for sure what will come this year.
Summary
So… despite what you may have read, there is no higher chance of a cold, snowy winter than usual. In fact, it may be just the opposite. We’ll be putting out our very first long-range winter forecast later this month, but in the meantime, cross your fingers and toes that this year delivers.
Don’t miss what everyone in town is talking about.
Join 4,000+ locals and choose our free newsletter covering news, events and the stories shaping our region.